Animations
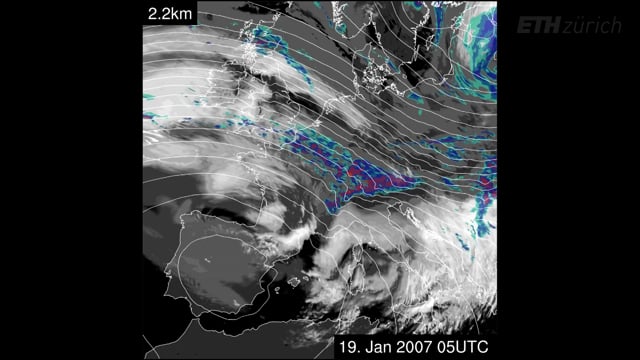
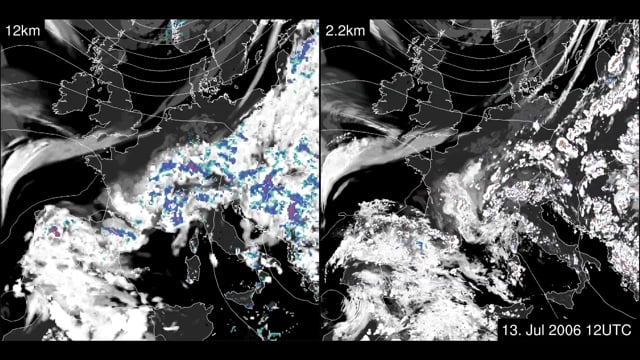
Visualisation of a European-scale climate simulation at a horizontal resolution of 2 km
The animation shows precipitation intensity (in yellow/violet/black) and vertically integrated cloud water and cloud ice (Christian R. Steger, Patricio Velasquez and Christoph Schär; ETH Zürich; project scClim).
Eight Days of Precipitation Cells (10 – 17 April 2000)
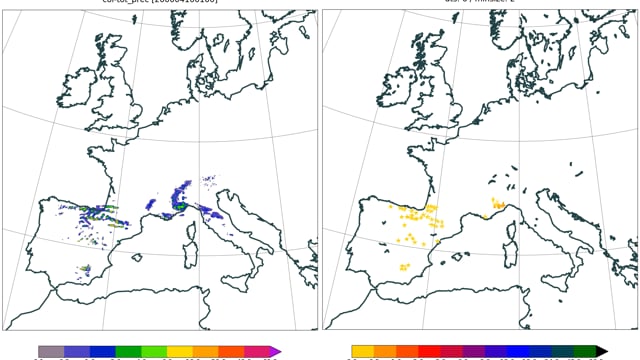
(Left) Six-minute surface precipitation field (mm/h) at 2.2 km resolution and (right) precipitation cells from 0006 UTC 10 April to 0000 UTC 18 April 2000. The precipitation cells are defined by exceedence of 2 mm/h on a reduced 6 km grid. For each cell, the outline (filled gray; only visible for large features) and the center are shown, colored by the current track age. The center symbol depicts the current track event (star: genesis; cross: lysis; circle: continuation; right-pointing triangle: merging; left-pointing triangle: splitting; diamond: merging-splitting). To illustrate recent cell movement, the previous six center symbols are shown transparently.
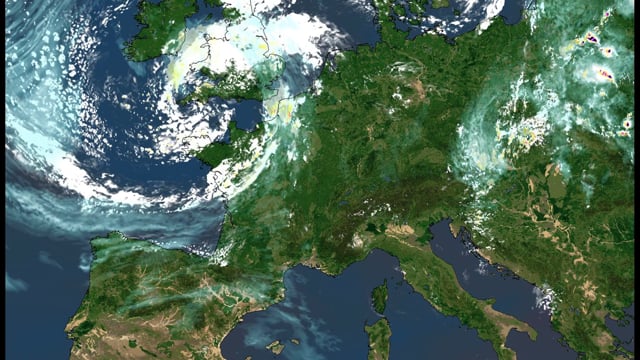
Continental-Scale Climate Simulation at Kilometer-Resolution
Winter Storm Kyrill in a Continental-Scale Convection-Resolving Climate Simulation